


| Main centres: | 1-3 business days |
| Regional areas: | 3-4 business days |
| Remote areas: | 3-5 business days |
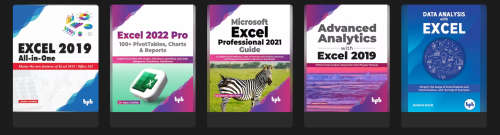
You will get the below eBooks .
100% practical guide to understanding and using Basic to Advance level Excel 2019
Key Features
Whats New in Excel 2019 / Office 365
Putting Data into Excel
Transforming and Managing the Data
Formulas and Functions
Data Analysis techniques
Data Visualization techniques
Multiple ways of Data Extraction
Automation in Excel through Macros
Description
Excel is, by far, the most preferred spreadsheet program on this planet. People love it because of its simplicity and easy user interface. The primary focus of Excel is to perform basic to advanced-level numeric calculations. Every industry, department, and job role is dependent on Excel to perform day-to-day duties as well as data analysis and visualization. Microsoft Excel is available in both offline (Excel 2019) and online (Office 365) versions.
If you are new to Excel or use this program day in and day out, then this book will surely clear your logic and concepts of excel.This book starts with an introduction to the Excel program and an overview of its interface and moves towards an explanation of new features being introduced in Excel 2019 and Office 365, then an in-depth discussion on entering and transforming data. Understanding different formulas and functions with practical exercises. Afterwards, how to perform data analysis and present it using different data visualization tools. Finally, extracting data and automation of tasks through Macros.After going through this book, you will become conceptually strong in using various features of Excel. You will increase your productivity by understanding and using the right tool for the related data set.
Learn Everything about Excel Charts, PivotTables, and Dashboards and Master Analytic Techniques for Decision Making
DESCRIPTION
Excel's charts, graphs, and reports are beneficial, so it's time to use them to your advantage. Learn how to execute the most innovative analysis on your preferred data using PivotTables, PivotCharts, What-if-Analysis, descriptive statistics, correlations, histograms, sparklines, animated charts, dashboards, trendlines, and more than 100 other charts and graphs.
The power to build a successful career is at your fingertips with Excel 2021
DESCRIPTION
Do you struggle with handling Excel data?
Do you waste a lot of time figuring out which formulas and functions to use for your day-to-day office work?
Even so, do you still want to become a master of Excel's most advanced features and techniques?
This book will teach you the fundamentals and most beneficial uses of Microsoft Excel through various examples, practical illustrations, and good shortcuts to make your life easier with it. To begin, we'll look at the numerous features every professional needs to manage enormous volumes of data. The reader will discover how to import data from various sources and cleanse and arrange it.
You'll learn how to use Excel's formulas and functions, as well as how to analyse data in a variety of ways. This book will demonstrate how Excel's new capabilities combine AI and ML to improve and simplify data visualisation straightforwardly. This book will teach you how to solve business problems using Excel's built-in functions.
Explore different ways and methods to consolidate data, complex analysis, and prediction or forecast based on trends
Key Features
Use the Analysis ToolPak to perform complex Data analysis
Get well-versed in the formulas, functions, and components of Excel
Handy templates to give you a head start
Usage of multiple examples to explain the application in a real-world scenario
Implement macros for your everyday tasks that will help you save time
Explore different Charts types for Data visualization
Description
The book explains and simplifies the usage of Excel features and functionalities, with the help of examples. It starts with Getting Started with Excel and Performing functions with shortcut keys which will help you in getting started with Excel. Then Formulas and Functions gives an initial understanding of what are operators, formulas, functions, and their components. Further Data Visualization with new Charts types, Gantt and Milestone chart, SmartArt and Organization Chart give details on the different chart types available in Excel.In the intermediate section, you will learn Get creative with Icons, 3D models, Digital Inking details multiple new and improved features that got introduced to enhance the visual presentation. In the end, Chapters Mail Merge using Excel, Create Custom Excel Template and Macros in Excel explain the Excel features that help in automating tasks. You will learn how to generate multiple documents automatically with customization, create and use your own templates and use macros to do the repeated task automatically.
And at last Chapter Get help for your problem lists a few problem statements and their probable solutions with references to the Excel feature or functionality that can be used to resolve the problem.
Simplify the Usage of Excel Features and Functionalities, with the Help of Examples
Key Features
Basic components of excel, the available menu options and tools, some customizations working with multiple workbooks and worksheets, most frequently used and useful keyboard shortcuts.
An initial introduction to what are formulas, functions, and their components. Usage of multiple examples to explain the application in real-world scenarios.
Explaining of different chart types available in Excel and how best it can be used for creating different views of data, good graphics, visualizations for dashboards, and so on.
Different ways and methods to consolidate data, complex analysis, and prediction or forecast based on trends.
Excel features that help in automating tasks.
Description
The book is written in a lucid manner to explain the concepts in detail, with adequate emphasis on examples. The intent of this book is to explain and simplify the usage of Excel features and functionalities, with help of examples. Book will enable users in working efficiently and will increase their workplace productivity. It explains Functions for calculations Graphing tools Pivot tables Data analysis tools Micro programming Add-ins that enable core complex operations.